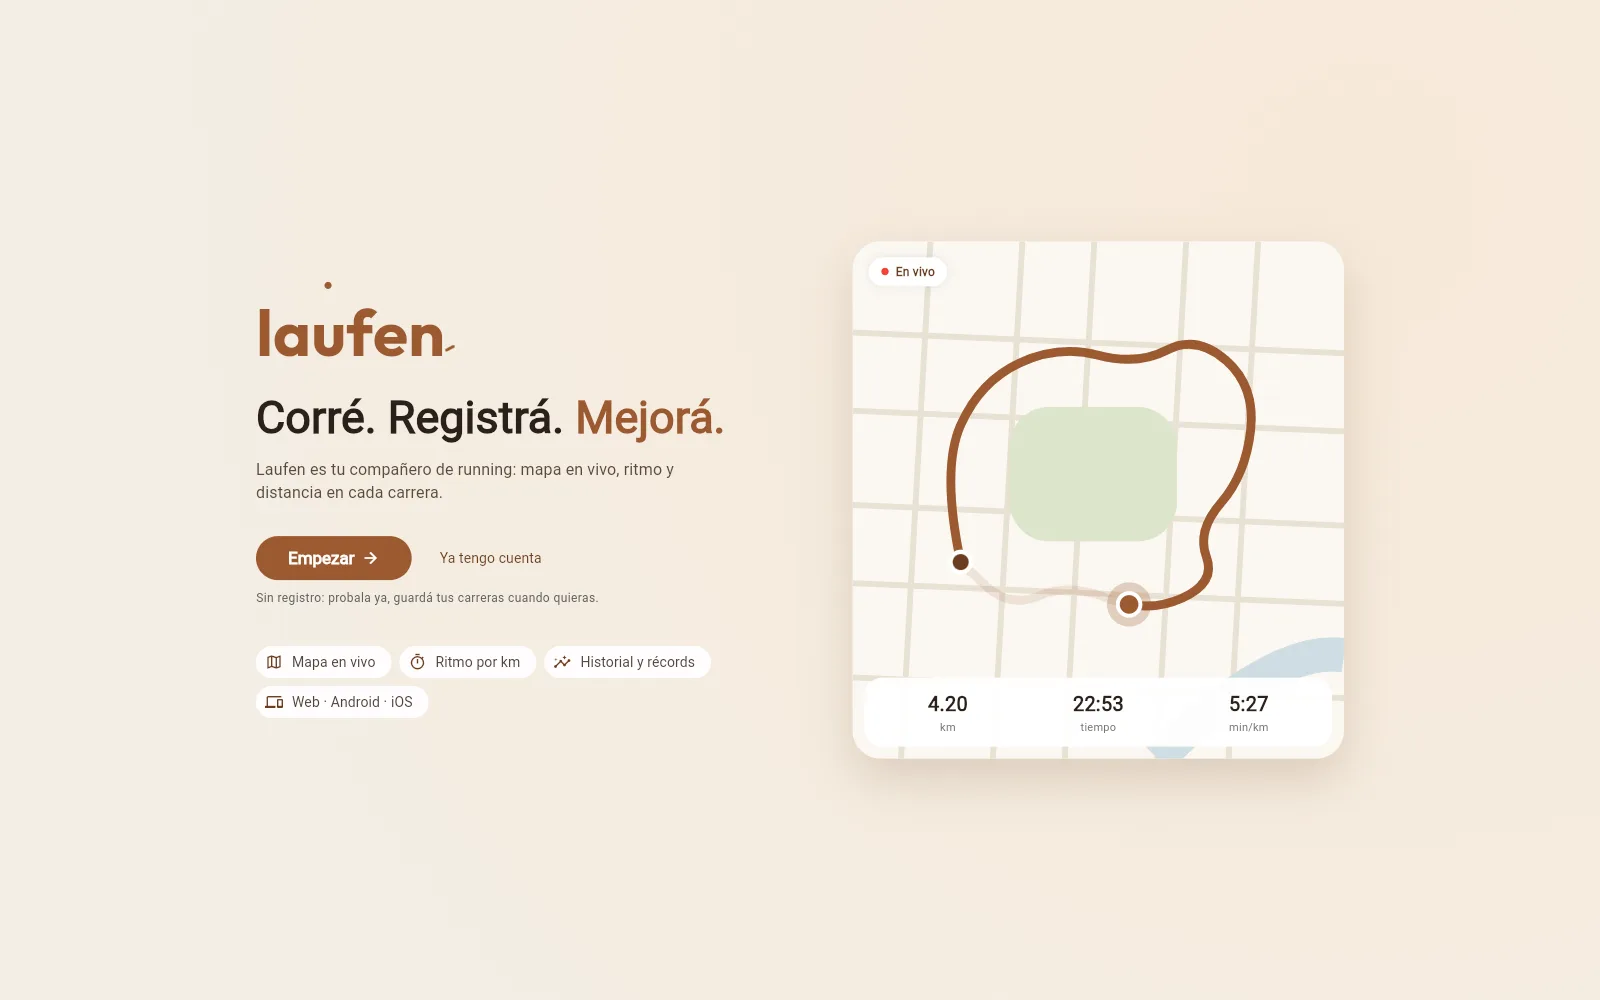
AI Dashboard
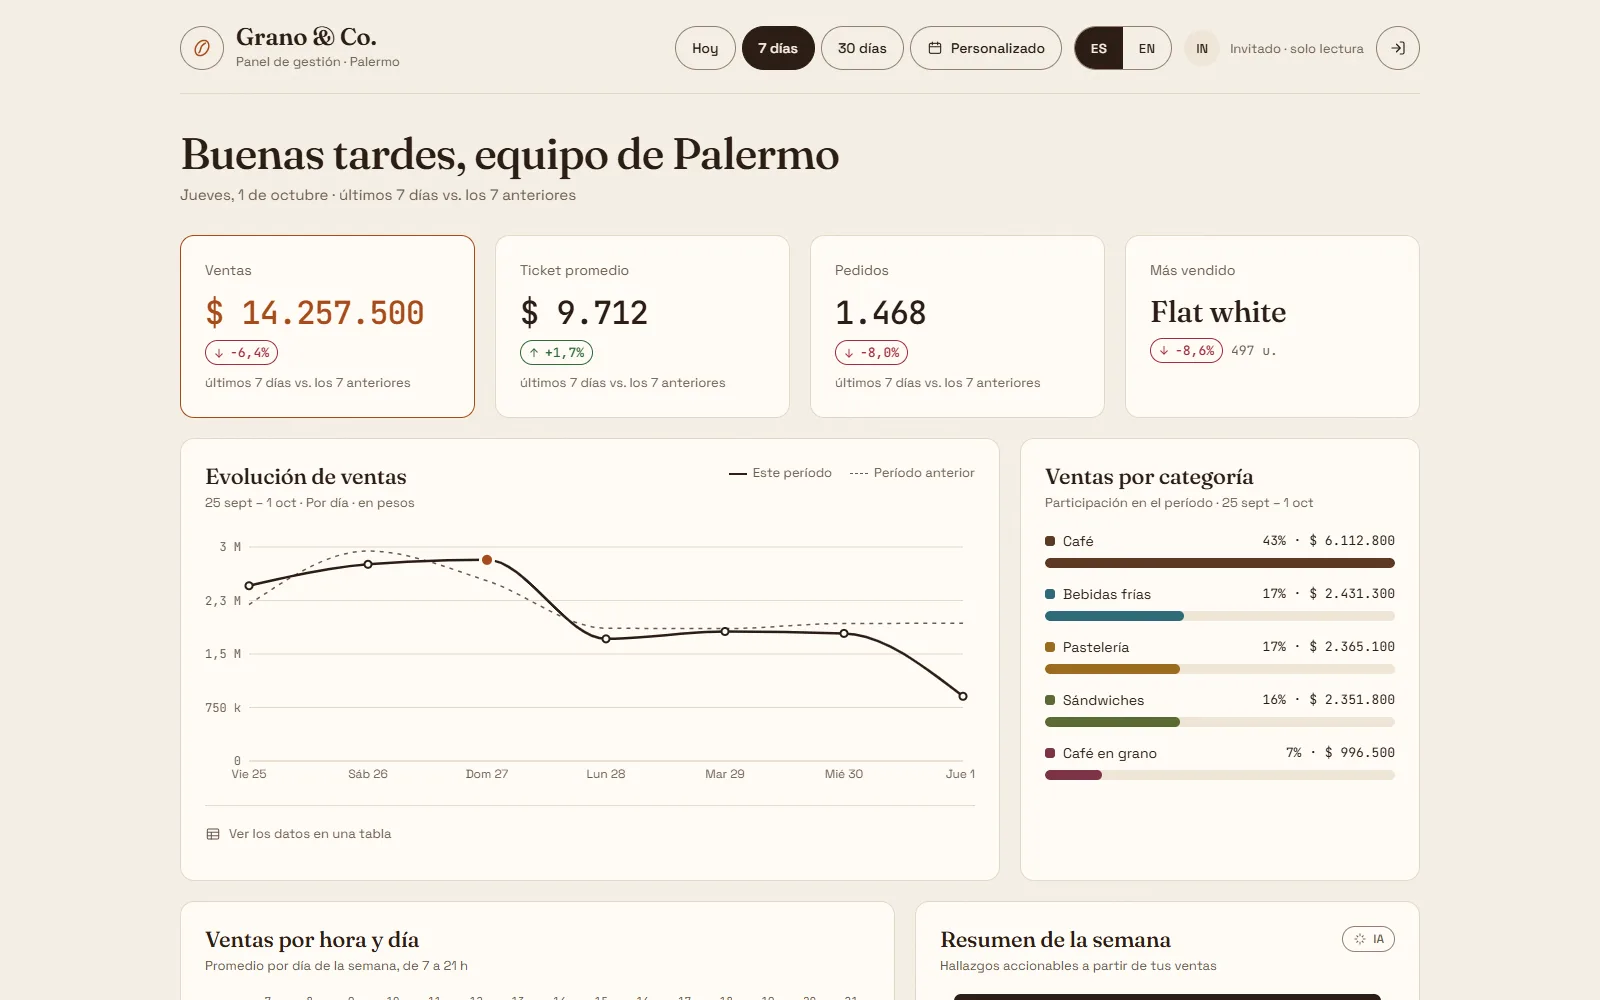
Management dashboard for a specialty coffee shop: sales, orders and stock on one screen, plus a weekly summary written by Claude that prints out like a café receipt.
- Role
- Design and development
- Status
- Live
- Stack
- Next.js · React · TypeScript · Firebase · Claude API · TanStack Query · Zod
The problem
A small café has its sales in the point-of-sale system, but nobody looks at them: there's no time to cross-check peak hours, growing products and stock. The goal was a dashboard you understand in five seconds that, beyond showing numbers, tells you what to do this week. As a portfolio project, it also had to open in one click, with no sign-up.
Outcome
Live on Vercel, with automatic deploys from GitHub. Lighthouse: 100 in accessibility, best practices and SEO, and 99 desktop performance; mobile is around 75 and is the next thing to improve. Main takeaways: plan for what happens when something fails (if the AI doesn't respond, the dashboard still shows a summary), and test in production, because several issues only showed up after deploying, not on my machine.
Technical decisions
Built with Next.js and TypeScript, with the data in Firebase. Instead of reading thousands of orders, I store one summary per day, so the dashboard loads fast and costs less. The AI is called from the server: the key never reaches the browser and every response is checked before it's shown. To keep costs under control, the summary is generated once a week and there's a daily usage limit per person. The sample data refreshes itself every hour, so the dashboard always shows today. Custom design, in Spanish and English, and accessible.